
In the spring of 2020, life changed for everyone. Public schools, private schools, daycare, universities, dine-in restaurants, sporting events, organized sports, concerts, movie theaters, trips to the mall, amusement parks, public pools, beaches, neighborhood parks, and travel were all put on hold. The COVID “stay at home” order affected nearly every aspect of daily life, including real estate.
The California governor ordered the lockdown on March 19th. The initial shock of a worldwide pandemic not only deterred buyers from purchasing but also inhibited plenty of homeowners from selling their homes as well. In March, there were 25% fewer sellers than the 3-year average before the pandemic (2017 to 2019) in Orange County. In April, it rose to 49%. It then dropped to 24% fewer in May and 11% less in June. By July, more sellers came on the market than the 3- year average. There were 4,389 missing sellers from March through June, 28% less.
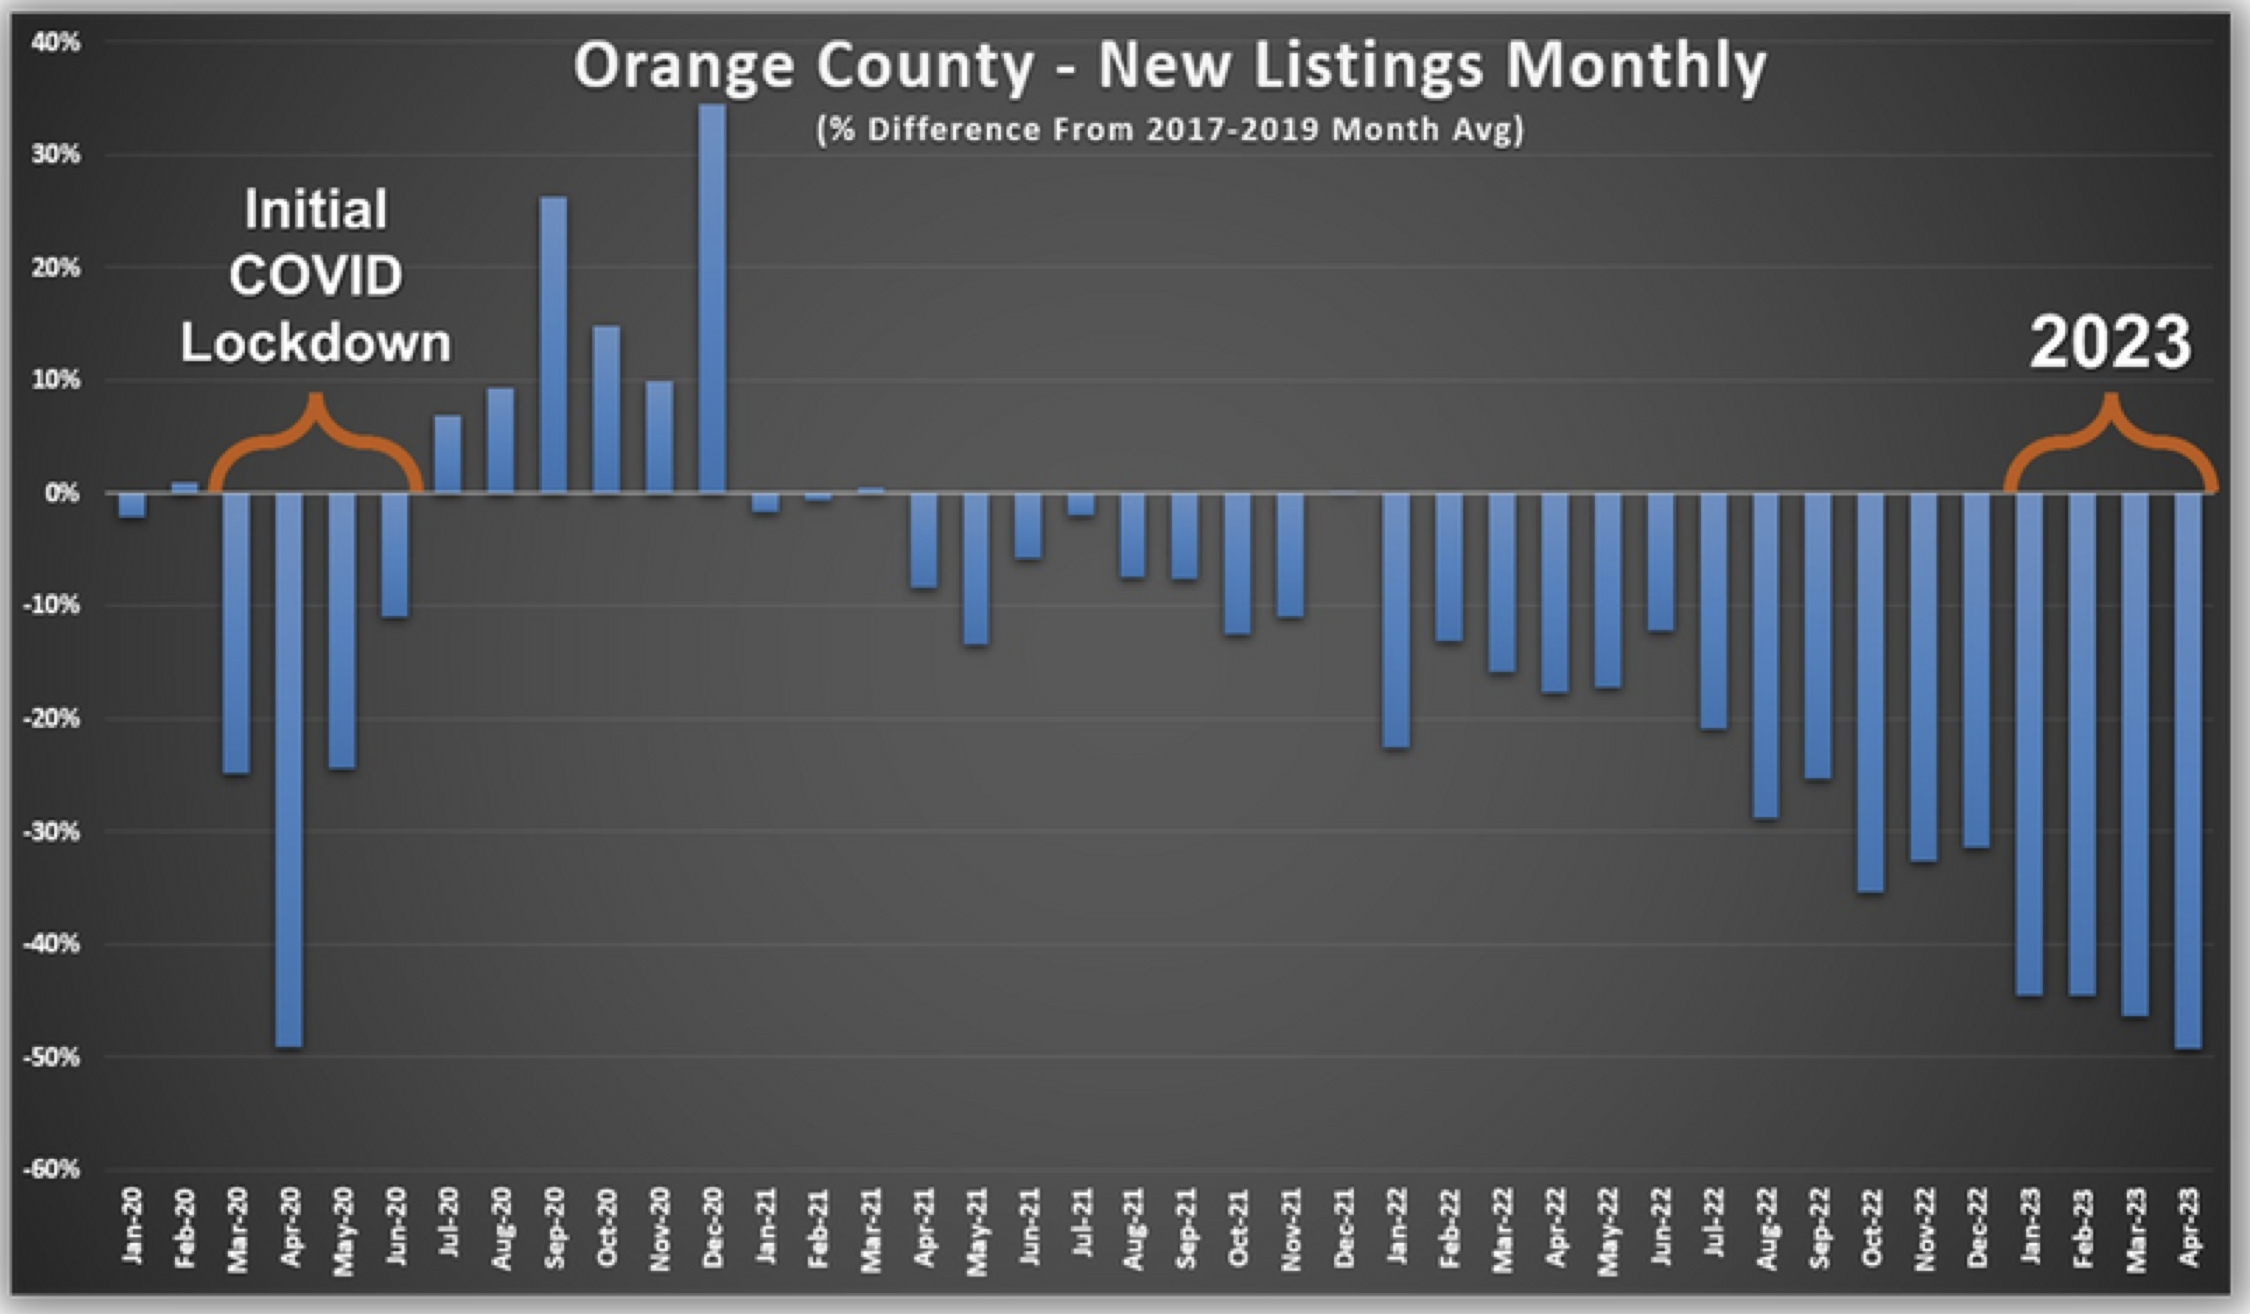
Overall, in 2020, there were 1,795 missing sellers compared to the 3-year average, down by only 5%. In 2021, it was down by 6% or 2,297 sellers. In 2022, everything changed. COVID no longer had a grip on the country, yet the number of homeowners that decided to sell dropped substantially. An astonishing 22% fewer homeowners opted to sell, or 8,460 missing FOR-SALE signs.
The swift, unprecedented rise in long-term mortgage rates in 2022 prevented homeowners from selling. They climbed from 3.25% in January to 4% in February, 5% in April, 6% in June, and eclipsed 7% in October. By year’s end, they settled at 6.5%. Many homeowners elected not to sell. They were locked into incredibly low fixed mortgage rates. According to the Federal Housing Finance Agency’s National Mortgage Database, 89% of Californians with a mortgage have a rate of 5% or lower, 71% have a rate of 4% or lower, and 29% have a rate of 3% or lower. Comparing monthly payments at 7.37% (the high water mark on October 20, 2022, according to Mortgage News Daily) to 3.25% at the start of 2020 is enlightening. The principal and interest payment on a $700,000 mortgage shot up from $3,050 in January to over $4,800 by the end of October, an additional $1,750 per month or $21,000 per year.
If a homeowner sold and decided to purchase a replacement property, they would have had a much higher payment and, most likely, much higher property taxes. Thus, they had been staying put. The “hunkering down” trend that started in 2022 only deepened in 2023. In January, there were 45% fewer sellers, or 1,362 missing FOR-SALE signs. In February, there were another 984 missing signs, off by 45%. In March, it rose to 1,810 absent signs, or 46% less. And, in April, it grew to 1,983 fewer sellers, down by 49%, similar to April 2020, the month with the most missing sellers during the initial COVID lockdown. From January through April, there has been an extraordinary 6,551 fewer sellers compared to the 3-year average before the pandemic, 46% less.
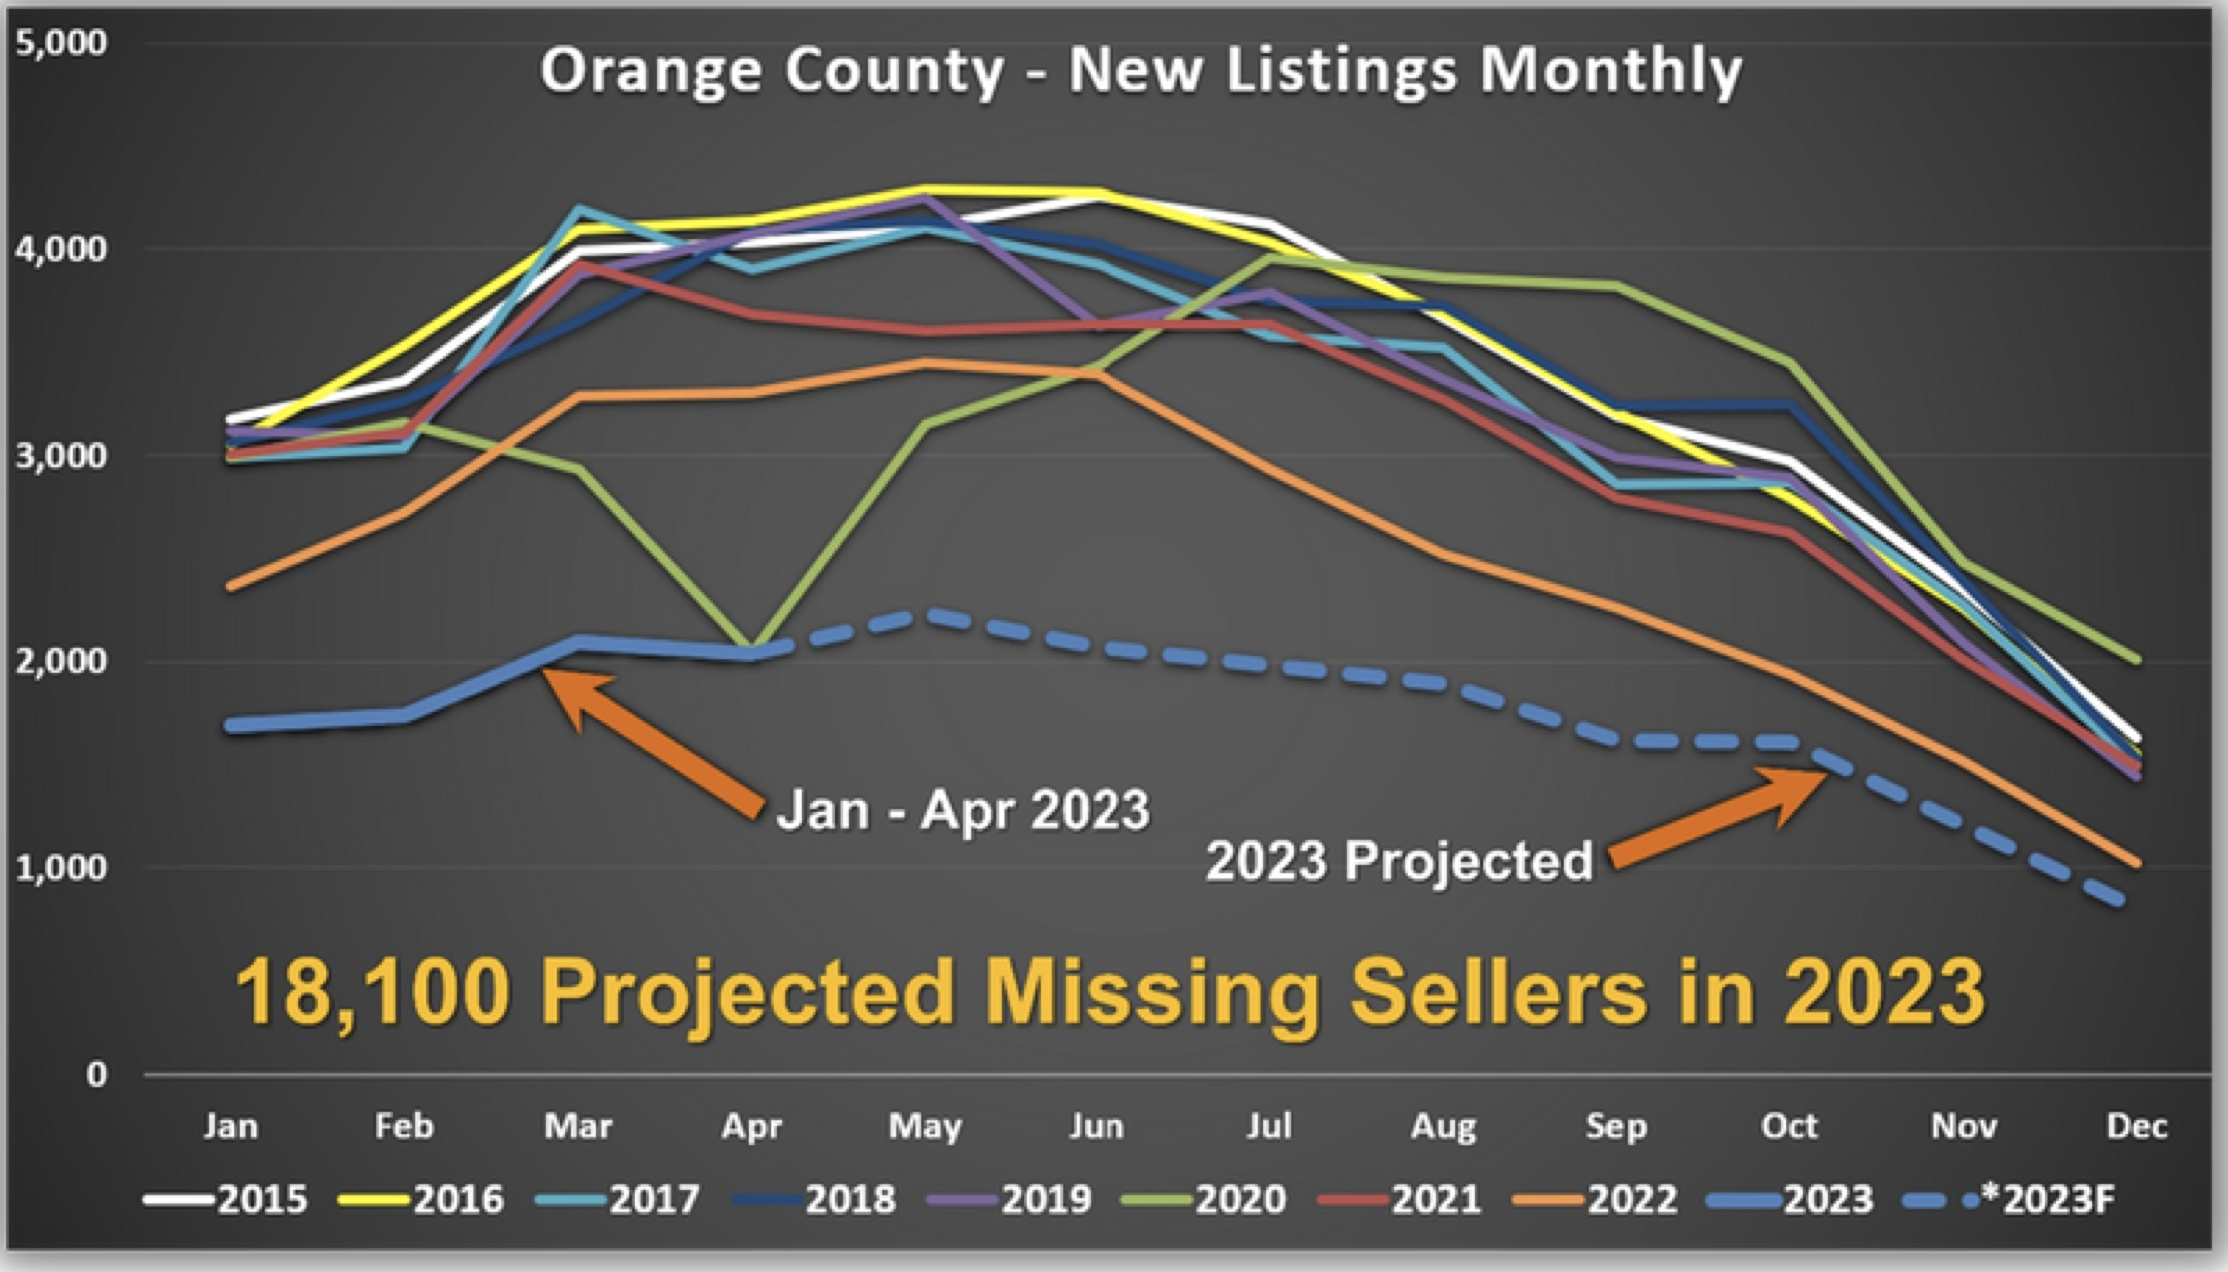
Based on the first four months of 2023, it is projected that there will be 18,100 missing sellers. Many homeowners would like to move for various reasons yet are staying put and enjoying their low fixed monthly payments. Their home may not be exactly what they desire, but they love their current loan.
Many ask when more sellers will opt to place their homes on the market and finally sell. That will occur when mortgage rates drop to 5.5% or lower. The gap between many homeowners’ prevailing underlying fixed rates will eventually narrow enough to entice many to list their homes for sale. That is when the need to move will kick in. The need for a growing family to purchase a larger home. The need for empty nesters to downsize. The need to move closer to the kids. While many are already selling today, lower rates will bridge the gap, and the number of sellers will grow. Until then, the 2023 inventory will continue to be constrained.
Active Listings
The active inventory finally increased in the past couple of weeks.
The active listing inventory increased by 23 homes in the past two weeks, up 1%, and now sits at 2,076 homes. Even with the slight rise, fewer homes are on the market than last year. This is the first time there are fewer than the prior year since April 2022. It is the lowest level to start May since tracking began in 2004. Typically, the inventory starts rising in January or February at the latest. This year it fell through mid-April, shedding 454 homes since the start of the year, down 19%. The inventory is having difficulty rising from today’s unbelievably low level. To buyers in the marketplace, it feels like they are competing for crumbs. This is due to the lack of sellers coming on the market, a trend that has only deepened since last year. With the spigot of new sellers turned down substantially, any new homes to hit the market will be bid on swiftly and thrown right into pending status, as long as sellers do not overprice. Expect the inventory to grow slowly from here until it peaks sometime over the summer between July and August.
Last year, the inventory was 2,104, 1% higher, or 28 more. The 3-year average before COVID (2017 through 2019) is 6,002, an additional 3,926 homes, or 189% extra, nearly triple where it stands today.
Homeowners continue to “hunker down” in their homes, unwilling to move due to their current underlying, locked-in, low fixed-rate mortgage. The difference between their underlying rate and today’s prevailing rate is significant and precludes many homeowners from listing their homes for sale and moving to another house. This will continue until mortgage rates drop. For April, 2,037 new sellers entered the market in Orange County, 1,983 fewer than the 3-year average before COVID (2017 to 2019), 49% less. These missing signs counter any potential rise in the inventory.

Demand
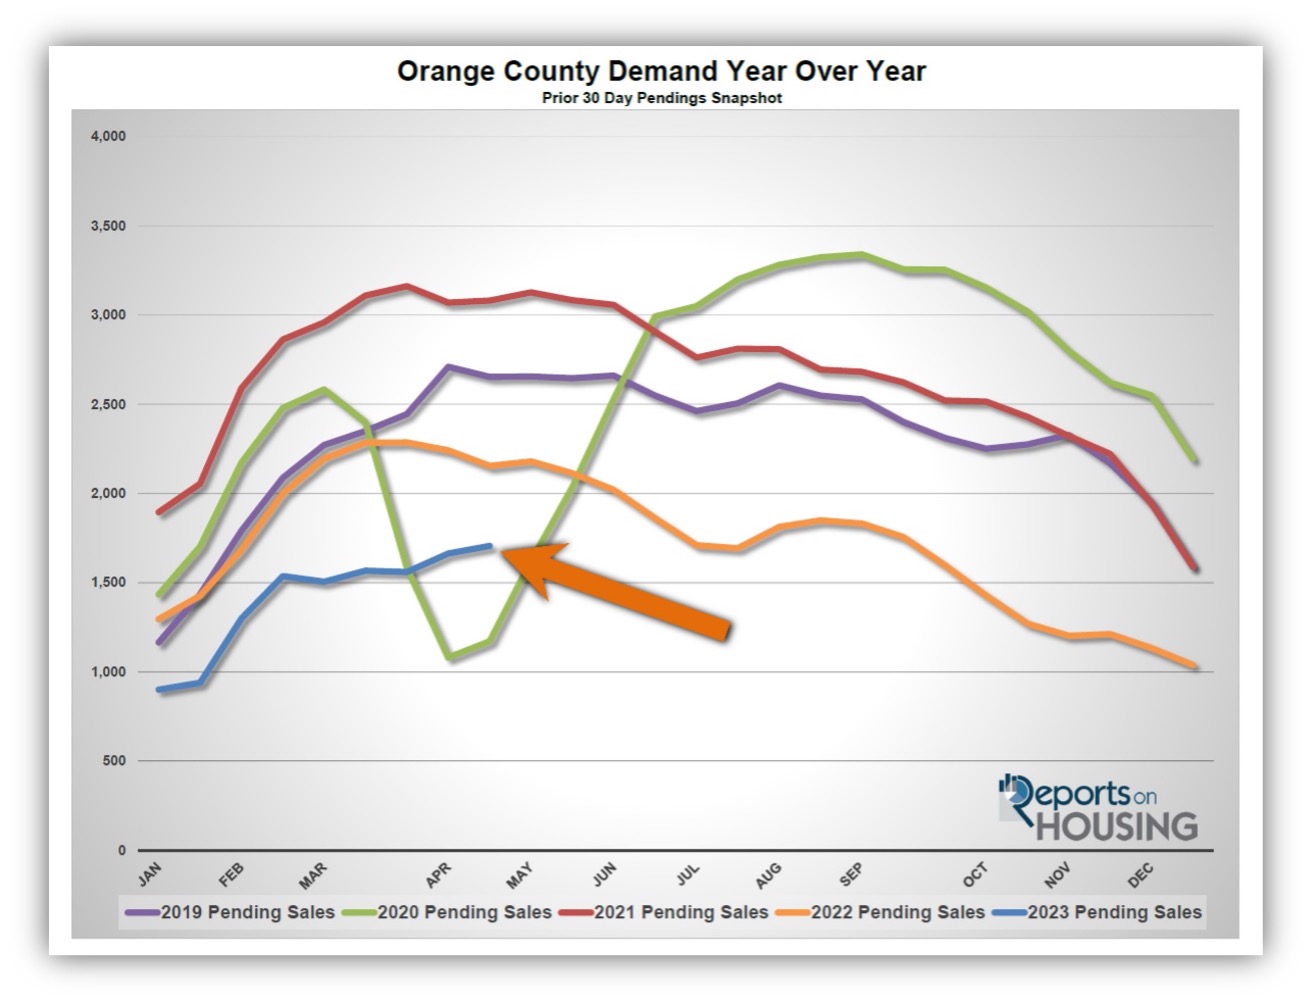
Demand increased by 3% in the past couple of weeks.
Demand, a snapshot of the number of new escrows over the prior month, increased from 1,663 to 1,706 in the past couple of weeks, up 43 pending sales, or 3%. Today’s level is still the lowest for an end to April since 2020, during the initial COVID lockdown. Demand is currently thwarted by the lack of affordability due to the high mortgage rate environment. Not everyone can afford to purchase, with mortgage rates bumping around the mid-6s. Since demand is a snapshot of the number of recent pending sales, the reading would be a lot higher if there were more homes to purchase. Quite simply, buyers cannot buy what is not available. Demand readings are dramatically impacted by the spigot of new homes on the market at about 50% of the normal flow. Currently, for every price range other than luxury, buyers are bumping into each other at open houses, they are competing against multiple offers, and many homes are selling above their asking prices. The housing market feels insanely hot because buyers are competing to purchase the few houses that come on the market. This will only grow substantially worse when mortgage rates drop further. As rates fall, bridging the gap between homeowners’ low underlying fixed rate and the current prevailing rate, more sellers will finally decide to sell. Yet, affordability will improve, and buyer demand will increase. The Orange County housing market is poised to continue at its insane pace for quite some time. There is seemingly no relief on the horizon.
Last year, demand was at 2,154, 26% more than today, or an extra 448. The 3-year average before COVID (2017 to 2019) was 2,780 pending sales, 63% more than today, or an additional 1,074.
With rising supply and demand, the Expected Market Time (the number of days to sell all Orange County listings at the current buying pace) remained unchanged at 37 days in the past couple of weeks, its lowest level since May 2022. At 37 days, the market is hotter than the 84-day level to start the year, but this is more of a function of a lack of supply and not record-breaking demand. Last year the Expected Market Time was 29 days, slightly faster than today, yet it was cooling fast due to increasing rates. The 3-year average before COVID was 65 days, a slower pace than today.
Luxury End
The luxury market did not change much in the past couple of weeks.
In the past couple of weeks, the luxury inventory of homes priced above $2 million increased from 637 to 677 homes, up 40 homes, or 6%, its highest level since December 2022. Luxury demand increased by 11 pending sales, up 6%, and now sits at 201, its highest level since August 2022. With the inventory and demand rising at the same rate, the Expected Market Time for luxury homes priced above $2 million remained unchanged at 101 days, its lowest level since June. While the luxury market is not instantaneous like the lower ranges, it is similar to last year and is relatively fast for luxury homes priced from $2 million to $6 million.
Year over year, luxury demand is down by 13 pending sales or 6%, and the active luxury listing inventory is up by 109 homes or 19%. Last year’s Expected Market Time was 80 days, slightly better than today. The year-over-year difference is narrowing.
For homes priced between $2 million and $4 million, the Expected Market Time in the past two weeks remained unchanged at 72 days. For homes priced between $4 million and $6 million, the Expected Market Time decreased from 212 to 116 days. For homes priced above $6 million, the Expected Market Time increased from 341 to 353 days. At 353 days, a seller would be looking at placing their home into escrow around April 2024.
