By early fall of 2016, Orange County’s real estate housing market should begin to enter the fourth and final phase of this current housing cycle – which happened to begin in the fall of 2011.
The housing market goes through definite cycles, similar to the seasons – just longer in duration. Below is an overview of Orange County’s housing cycles, with an analysis of the first three phases and what to expect during the 4th phase.
Phase I
This phase begins shortly after a housing recession has ended. The cycle usually runs from 18 to 24 months and it has a dramatic effect on housing. Potential buyers, who have been out of the market during the downturn, are referred to as “fence-sitters” and they finally jump off and buy. The investors are out in droves, buying at the bottom of the market. They either keep the property as an income-producing asset or they “flip” the property for a quick profit. Then there are the usual buyers who are making their purchases. If the inventory is low, sellers experience “multiple offers” in this phase, which quickly drive prices upward. Unfortunately, the first-time buyers who desperately want to acquire a home find themselves being out-bid by competing buyers who are paying either all cash or who have more money to put down on a property. During this cycle, first-time buyers’ offers are often denied – thus pushing them out of this phase of the housing cycle.
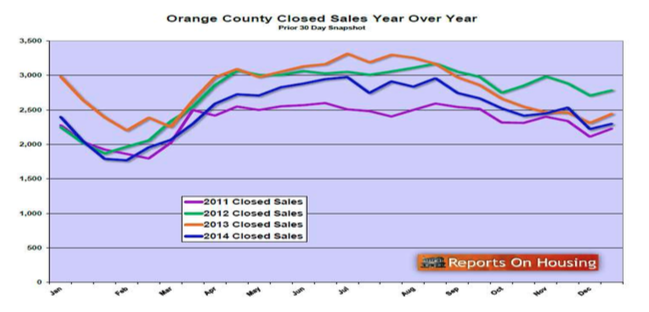
This cycle began in the late spring of 2011 and continued until the early fall of 2013. In Orange County, home prices rose almost 40% over those 22 months. After 7 consecutive quarters of price gains, the 4th quarter of 2013 saw a double digit downturn in sales. In all of southern California, prices were up 22.3% from the previous year, but still 21.8% below the median peak prices in the spring/summer of 2007. Southern California had 21 consecutive months of sales gains until the 4th quarter of 2013. This signaled the end of Phase 1. The chart below shows that only 2011 had fewer sales than 2014.
Phase II
This cycle began in the 4th quarter of 2013 and continued throughout 2014. Housing appreciation, in this cycle, normally gets cut in half. Inventory of homes grows as the number of buyers’ decrease, thus causing price reductions for homeowners who overpriced their properties, still thinking that the real estate market was strong. In this cycle, all categories of buyers (fence-sitters, investors, first-timers) decrease. The lowered demand, along with the increased supply of homes, were the major causes of home appreciation being cut in half (in comparison with Phase 1).
In 2013 we saw appreciation of 21%, but in 2014 home appreciation had been cut in half. The upper 1/3 saw the median price rise 10.2% but sales dropped 14%. The mid 1/3 saw a price gain of 9.8% with a 9.5% decline in sales. The affordable bottom 1/3 saw the median price rise 10.4% but sales declined 15%. Throughout southern California, sales fell by 8.7% and the median price appreciated only 5.7%. Orange County is still 8% below its peak median sales price, while Southern California as a whole is 17.8% lower. This phase lasted about one year.
Phase III
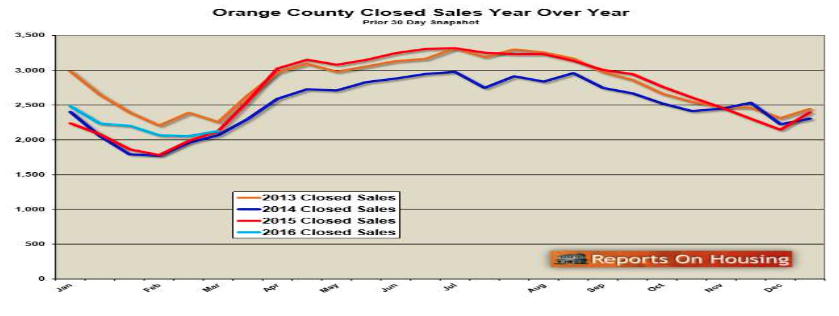
In 2015, the housing cycle entered the third phase later than expected. Normally this phase would have ended in the 4th quarter but sales remained strong – rising 6% in that quarter over the previous year. These stronger sales might have been attributed to the Federal Reserve threatening (throughout the year) to raise interest rates. As the year came to a close, sales actually increased rather than having an expected decreased. Orange County ended the year with total sales of 36,643 which was an increase over last year by 7.4%. The chart below shows how the sales occurred throughout the year compared to previous years. Existing resale home sales through the MLS gained by 8.7% while the existing condo sales rose 22%. The higher end of the price range had been strong but now has begun to falter!
However, the appreciation rate did what was expected. It declined by half from the previous year (Phase 2) and ended the year with an annual composite appreciation rate of 4.8%. As they year came to a close, Orange
County home prices in the three categories were as follows:
Single Family Homes: 22,754 – Up 10.1%
Existing Condos: 10,363 –Up 11.9%
New Homes: 3,526 – Down 15.3%
Appreciation Rate
Single Family Homes: 4.1%
Existing Condos: 5.5%
New Homes: 5.9%
Phase IV
So what is likely to happen in this final phase? For the first 6 months, things will continue to look pretty good. Home sales should continue but at an even smaller rate of appreciation. The rate will remain around the 3- 4% range but will begin to decline, after the summer selling season has ended. By the end of the year, appreciation rates should be near zero, if they have not already turned negative. This decline in appreciation will mark the fact that we are now in phase four of the real estate cycle. If inventory continues to stay extremely low, phase four would get pushed into 2017. Here are the guideposts that show we have entered Phase 4:
● A decline in new home sales – down 15.3% in 2015 – even after buying credits of $5,000 to $100,000!● Declining appreciation – last year averaged 4.8% and as of last week (3/20/16) we were at 3.6%
● A decline in home sales versus the previous year!
● High-end properties sales begin to decline.
The Investors:
There will be a decrease in investor purchasing, as prices are now showing very little appreciation. Investors will now make an acquisition for two reasons: (1) the rental market is bringing a better rate of return (ROI) then investing in stocks, bonds or keeping the money in the bank; (2) foreign investors will be looking for a safe haven for their money (capital preservation) and betting that the U.S. dollar will continue to appreciate against their country’s currency. In 2013, Southern California investors represented about 32.4% of all sales. By the end of 2015, their acquisitions represented only 23.4% of all sales – down almost 10%.
The Buyers:
First-Time Home Buyers:
The first-time home buyer would most likely come from the “Millennials Generation.” Many will continue to remain out of the market for various reasons. First, they are reluctant to buy because they witnessed the first major real estate price declines of our lifetime. Watching their parents struggle with note modifications, short sales and foreclosures have led them to accept the fact that real estate does not always go up. Entering the housing market now means dealing with: (1) high prices (affordability); (2) stricter qualifying; (3) high unemployment rates (15%); and (3) low wages. Also, many potential buyers have been encouraged to “job- hop” for better opportunities and thus do now want to be tied down to a home or a mortgage. One of the biggest hindrances to qualifying is the amount of student loan debt they are carrying. Student debt has grown from $241 billion to $1.2 trillion today – up $480 billion dollars in just the last four years! There are 5.9 million householders under 40 now paying over $250 monthly on student loans, and 70% of recent college grads have some kind of student debt. At today’s interest rates, that reduces their purchasing power by $44,000, resulting in over 414,000 in lost home sales yearly. First-time home buyers historically made up approximately 40% of the home buying market. Last year in the U.S., they had fallen below 33%. In California, the number is 30.8%; in Southern California, by year’s end, the number had fallen below 28%.
In a recent survey of the Millennials, the following was discovered: 1. 20% already own a home
2. 68% do not have home ownership as a near-term goal
3. 12% see no reason to own a home
The Move-Up Buyers:
The traditional move-up market is being affected by the lack of purchasing by first-time home buyers. Real estate is a food chain! Entry level buyers are a major contributor to the upward movement of the owners of median-priced housing. Without first-time buyers entering the market, the condo and lower-price-range single family homes lack buyers to help those homeowners move up to the median-priced housing market. As this occurs, median-priced housing homeowners can then move to the upper median housing. Without the entry-level buyers, the food chain does not function well.
Traditional (Equity) Buyers:
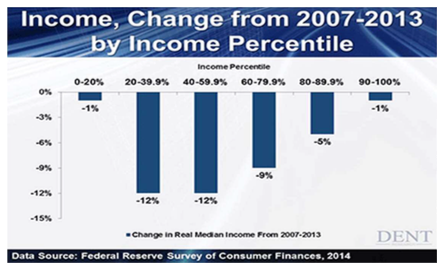
Normal buyers in the market too are faced with strict lending guidelines but, more importantly, they have experienced a loss of both wealth and income over the period 2007-2013. Although those at the bottom and top income brackets experienced little change in inflation-adjusted earnings over the past six years, those in and just below the middle income bracket were hit hard. Some saw their incomes drop by 12% while their net worth plummeted by 38%. With less financial security and economic and political uncertainty, fewer buyers will be making a move into the upper median housing market.
The Luxury Home Buyers:
It is no secret that the wealthy are accumulating the more wealth. They are the only wage group that has grown since 1971 – they represented 15% of the population. Today they have risen 21%, while both the middle and lower class have seen a decrease in their income. The top 1% earn 20% of all income and the top 20% earn 50%! In 2013, Pew Research Center found that the wealth gap between the country’s top 20% earners and the rest of America had stretched to its widest point in the past three decades. The median net worth of upper-income families reached $639,400, nearly seven times as much as those in the middle, and nearly 70 times the level of those at the bottom of the income ladder. In 2013, cash buyers represented 36.9% of the total sales market. By the end of 2014, the number had dropped to 23.8% and 2015 ended with 21% paying cash.
The market for foreign buyers will continue to remain strong but it too is showing signs of slowing down. California was getting over 20% of all foreign sales but in the year ending March 2015, California saw only16% of international sales.
The Ultra Wealthy ($30+ million net worth) has been hit hard in the 3rd quarter of 2015. Although home values were up $482 billion for them, they lost $1.2 trillion due to financial declines in the stock market and other investments. During the first 2 weeks of 2016, investors withdrew $8.8 billion from financial markets and by the end of February, the world’s stock markets had lost 2 trillion dollars!
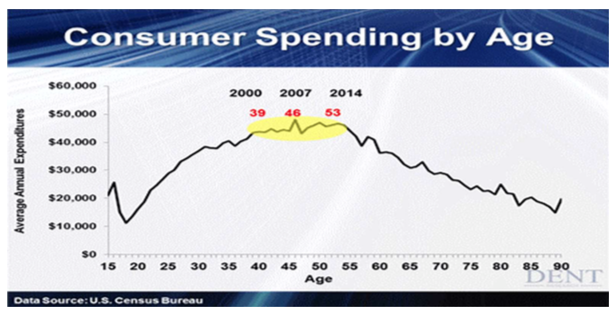
The baby boomers peaked in spending in 2007, the more affluent – top 10% to 20% did not peak until late last year. Up until now, their spending has been driving the economy. They have the highest income and they account for 50% of the spending! However, that ended half way through 2015. Luxury brands such as BMW, Nike, Este Lauder, Mercedes, Tiffany, Nordstrom, Restoration Hardware, Moet Vuitton, Carnival Cruises and VF Corporation have seen their stock prices slide as earnings growth have ended. The chart below tells the story.
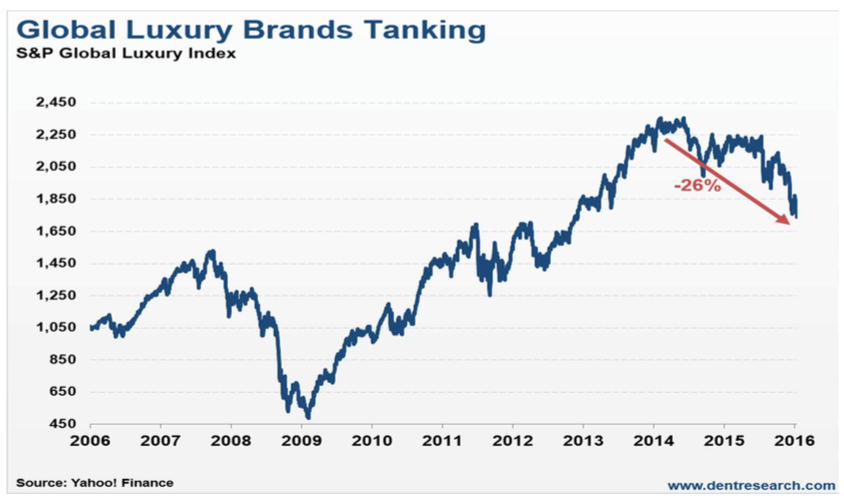
Other luxury retailers have been hit hard as well: Nordstrom down 36% in the past year; Ralph Lauren down 46%; Sotheby’s is off 48% since June; Tiffany & Co. down 32% since August; Williams-Sonoma down 44% since last August; Louis Vuitton down 24% since October. The Global Luxury Brands have fallen 26% from mid-2015 to February 11, 2016.
In the U.S., consumer spending was forecasted to rise 2.2% but only grew 2.0%. This left large inventories in stores and thus the dismal earning reports from Sears, BestBuy, Kohl’s, and Walmart. The latter two closing stores and reducing work hours for their employees. Sports Authority is closing 200 of its 450 stores while it files for Chapter 11.
And the sale of new homes in Orange County fell 15.3% last year and resale homes are 5% less than 2015. If this trend continues, these are indicators that phase four may be beginning.
Inventory of Homes:
The inventory of homes has a major impact on real estate and the anticipated appreciation rate for any one year. In the first phase of the real estate cycle, inventory is low as the pent-up demand of buyers begins to enter the market. Low inventory (supply) and many buyers (demand) quickly forces the appreciation rate up, as multiple buyers bid-up prices on a single property. Our historical average is 8,500 listings. Since 2005, the number of homes on the market has averaged 9,238. That was largely due to the Great Recession whereby a lot of the inventory was short sales and foreclosed properties! In 2015, we averaged 6,038 – a 34.5% decline from our historical average! The chart shows how the listing inventory flows throughout the year.
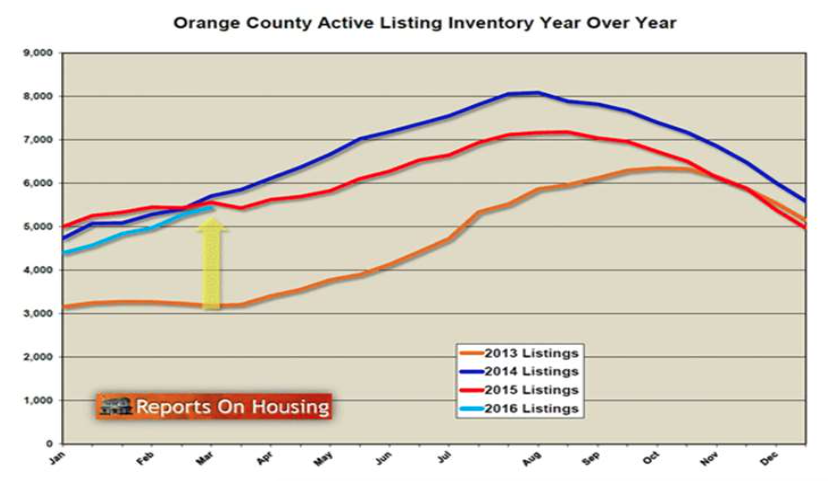
In Orange County, homes use to turn over approximately once every 7 years. Today, the trend is once in every 23 years! This trend of low inventory will help to keep home prices on the rise – unless the inventory numbers increase dramatically.
Looking at 2016
As real estate enters the fourth phase later this year, the economy faces a host of issues both domestically and globally. Our economy will grow less than 2%. This may prevent the Fed from raising interest rates throughout the year but if they do, it will not be more than 1⁄4 to 1⁄2% tops! Commodity prices should continue to fall preventing any significant inflation rate increases. Net job growth will be minimal and could even show a slowing. It should be a tough year for the stock market. Then there is the geopolitical environment. Here is a short look at each with my analysis for the year.
Housing:
This forecast deals with slower home sales, even with record low interest rates and the possibility of low housing inventory. The demand for housing is just not there for the reasons stated earlier.
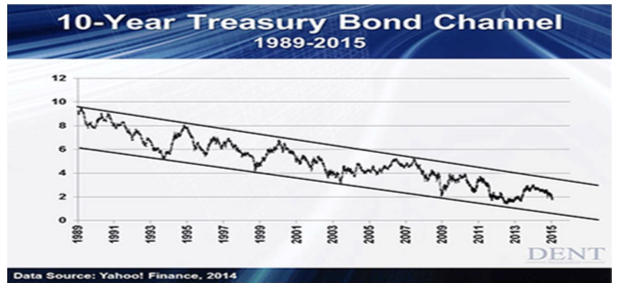
It might surprise you, but the U.S. has some of the highest interest rates in the world. Sixty-five percent (65%) of all global bonds earn less than 1%! Much of the world is fighting deflation and money is flowing into the U.S. bond market. With the dollar surging over other currencies, interest rates will be kept low throughout most of the year. If we look at Europe, the central banks are charging negative interest rates and now Japan as followed suit. This is not good for banks and puts pressure on the Fed not to raise interest rates.
The 4th cycle traditionally has fewer sales. The market should remain fairly good until late summer, then in the last quarter of 2016, a significant decline should take place. Even with a strong year in 2015, the MLS reported 30,337 sales, this was 8.7% over 2014 and the average resale price rose only 3.7%. In this cycle, I think sales will decline further and appreciation will only occur during the first half of the year. In the U.S., homeownership is at a 20-year low (63.7%) and that number will continue to decline. It is a demographic issue. Baby boomers are finished buying and the “millennials” don’t want to buy! After the summer surge (or lack thereof), appreciation rates will be near zero. By the end of the year, appreciation rates should begin to turn negative, even with low inventory.
Interest Rates:
Another forecast for last year was that rates would not go up more than half a percent but would decline throughout the year. Are you ready for this! Interest rates should go lower throughout the year. I know a lot of people think the Federal Reserve will raise rates but our economy (as well as the global economy) is still fragile. If they do raise rates, it won’t occur until late spring for the first one and then late fall for another. Even then, the increase would be minimal – not more than 1/2% for the full year!
It might surprise you, but the U.S. has some of the highest interest rates in the world. Sixty-five percent (65%) of all global bonds earn less than 1%! Much of the world is fighting deflation and money is flowing into the U.S. bond market. With the dollar surging over other currencies, interest rates will be kept low throughout most of the year. If we look at Europe, the central banks are charging negative interest rates and now Japan as followed suit. This is not good for banks and puts pressure on the Fed not to raise interest rates.
Job Growth:
There is a reality about job-growth numbers that the media never mentions. Each month, some of the “newly created jobs” actually go to replacing workers who have died and those taking leave for births. It usually averages a little less than half of the total job numbers. In February, 240,000 jobs were created but about 129,000 was to replace deaths and those leaving for maternity. Each year, that number is over 1.1 million or just under 100,000 monthly. When you look at this chart, you can see that half of the jobs are below the median hourly pay. These are bartenders, waitresses, and others employed in the leisure and hospitality business. No wonder U.S. productivity is still low. The chart shows the true employment numbers for February 2016.
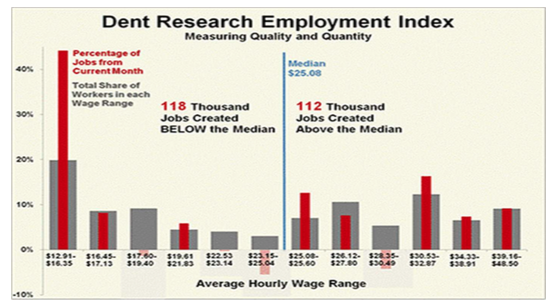
In the U.S., we now have as many employed individuals as we did in 2007!
In 2005 in Orange County, there were 1,555,000 employed individuals. As of January 2016, the number was 1,540,000 – after gaining 47,225 jobs in the previous year! Most of those jobs were in construction, health care and the leisure and hospitality fields. One third of all workers in the OC make less than $50,000. This anemic wage growth hurts consumer spending – which was the lowest in the last 4 years! OC lost jobs in manufacturing, retail, bank lending, administrative/support services and architectural/engineering services.
In the U.S., we have the same number of workers as there were in 2007. However, we had 17 million more potential workers graduating from various schools or immigrating into our country, over the last 8 years! It is hard to say we have a growing economy.
The Economy:
Since 2008, the Federal Reserve has printed $4 trillion to keep the economy afloat. Inflation-adjusted incomes are less than they were in 2000. Since 2008, the median earning percentile has fallen 12%. There are 46 states in the U.S. that have less average income less than that in 1999.
The strong dollar will put pressure on the U.S. economy and slow down any economic expansion. We will be lucky to see 2% GDP in 2016. In 2015, the GDP averaged 1.625%. The 1st Quarter company earnings are estimated to be down 8.3% vs. a forecast of 0.05% rise. If they do fall, it will be the 4th consecutive quarter of lower earnings. The major problem with the Federal Reserve is that their policies are not long term. They flow from month to month, keeping the financial markets very volatile.
This is one reason I feel the Federal Reserve will be reluctant to raise interest rates. It would hurt the consumer too much and thus hurt consumer businesses. Another reason for not raising rates is that the U.S. (and the world) is fighting deflation. Since 2008, commodity prices are down more than 47%. Oil price drops will wreak havoc on energy businesses in the U.S., which lost 100,000 jobs in 2015. The 11 major oil producing countries need the following price per barrel to meet their country’s financial obligations yet Saudi Arabia’s February 26th announcement (in Houston) at the oil conference stated that they will not reduce production. Their goal is to cause many oil companies (and countries) to go out of business! In mid- March, Saudi Arabia forecasted lower demand for oil as the global economy was slowing down. This could put more pressure (downward) on the price of oil.
The continued oil price drop will cause political upheaval in the less developed countries. There are 7 wars going on in the oil producing countries and still oil hovers around $30.00 a barrel. Do not be surprised if it goes to $20! As of late January, oil was at a twelve-year low. The impact of these continued declines will lead to job losses and a decline in the GDP. This disruption will cause many buyers and investors to take a very conservative approach to spending their money.
Speaking of the stock market, it is at a very high valuation. Fifty percent of the market’s profit for 2015 came in two weeks during December. Stock ownership is at an 18-year low, and 85% of stocks are owned by institutions. On a daily basis, 90% of the stocks are traded by high-frequency trading computers! It is really hard to have a seven-year run without some serious excesses being developed.
Geopolitical World:
The declining price of oil will create many serious issues for the oil producing nations. Most need oil to be around $85-$110 per barrel to balance their economies. The oil-fracking industry needs oil to be at $80 a barrel to service their debt. At these prices, 2016 will present some interesting financial issues on oil-related bonds, when the drillers cannot service the debt. Russia is a major commodity exporter and the 47% decline in commodities is hurting that nation. Europe is fighting deflation and trying to stave off a recession. At the end of the year, the Euro was at a 10-year low. Now Europe is going to try “quantitative easing”, as it will begin printing more money and lowering interest rates. Switzerland has so much money flowing into its Swiss franc that they are now charging depositors negative interest rates to “park” their money in their currency! Slower growth in Europe will put a damper on U.S. businesses that count on exports to European nations. China’s GDP has declined to 6.9% – cutting their growth in half! The Chinese economy is slowing down rather dramatically, and their exports declined 25.4% over the last year. This will have a ripple effect around the world.
Demographics:
Demographics have a major influence on the economy. The real estate sector needs to understand that two great events occurred after World War II that put real estate in the limelight:
• First, soldiers returned from the war with government aid, leading to the largest real estate buying binge in history. This led to the world’s first middle-class generation that could afford a mortgage.
• Second, shortly thereafter, a massive baby boom took place. It put tremendous pressure on existing real estate, especially in the coastal areas. This boom would also have a major impact on the economy as the boomers moved through their various stages of life.
Here is the unfortunate news… both of these trends are now over in the developed world! This helps to explain why, in an economy with a growing population, record low interest rates and available housing, home sales are continuing to show minimal appreciation. The baby-boomers are finished buying and a recent survey of the Millennials (25-36) showed:
- 20% already own a home
- 68% say it is not a near-term goal
- 12% are not interested in owing
This is the reason I am forecasting another “soft” sales year. By the way, as of mid-March, sales were down 5%, compared with 2015.
The Millennials lack of interest is due to various factors:
- High unemployment among their age group
- Lower wage earnings
- High student debt
- Want mobility in their lifestyle
5. Strict lending patterns
Another reason is that they saw what their parents (who were homeowners) endure during the Great
Recession and they do not want to go through something like that in their own lives!
The Facts:
China is projected to run a 3%-4% deficit this year. Their exports are down 6.6% and their imports were down 14.4% for the year. They have tried to prop up their currency (Yuan) by depleting their reserves by $1 trillion. To help get money into China, and help stop the currency outflow. For the first two months of 2016, their foreign reserves fell $147 billion so now they are now allowing foreigners to buy their bonds. All this will not help. The Yuan will get devalued this year.
China’s lack of imports is hurting Asia. Singapore’s exports were down 9.9% last year. Indonesia’s was down 20.7%; Japan down 12.9%; South Korea 18.8%. This will put tremendous financial strains on each of these countries.
In the U.S., new home sales fell 4.5% last year and were down 9.2% in January
In Conclusion:
When I speak to the real estate industry, I ask the agents the following question: “Please raise your hands if your clients are worried about purchasing real estate.” At almost every event, over 80% of the attendees raise their hands. Only San Francisco had the fewest hands go up – 50%!
New home sales are declining and the wealthy have begun to spend less. Fewer international buyers will be purchasing, due to their falling currencies against our rising dollar. Retail sales are down and major retailers are closing stores. When Walmart (who has 268,000 people purchasing good from their store each week) is showing slower sales, this is a major economic indicator of things to come. The chart below also shows how demographics comes into play. It is going to get tough for retailers!
I don’t see a major downturn for housing in 2016, but be prepared for a slowdown later this year. Interest rates should remain low throughout 2016 and inventory will levels will be the key to any housing appreciation. When the 4th quarter of this year comes to an end, it will clearly tell the story for our future and it will let us know we are entering . . . the 4th cycle of real estate!
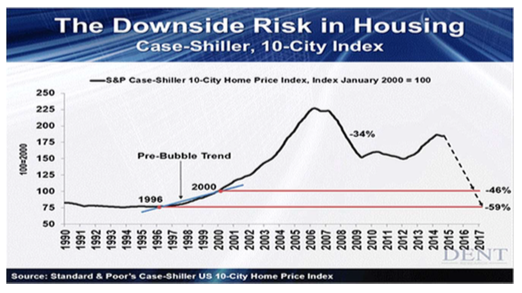
By the way, should we enter the 4th cycle, there is always this question: “How bad will it get?” Case-Shiller has already charted it out, for the 10 top cities in America!
Forecast written by Gary Watts. All information is deemed reliable.

